
📊 Structured Analysis Tools
Data Flow Diagram (DFD)
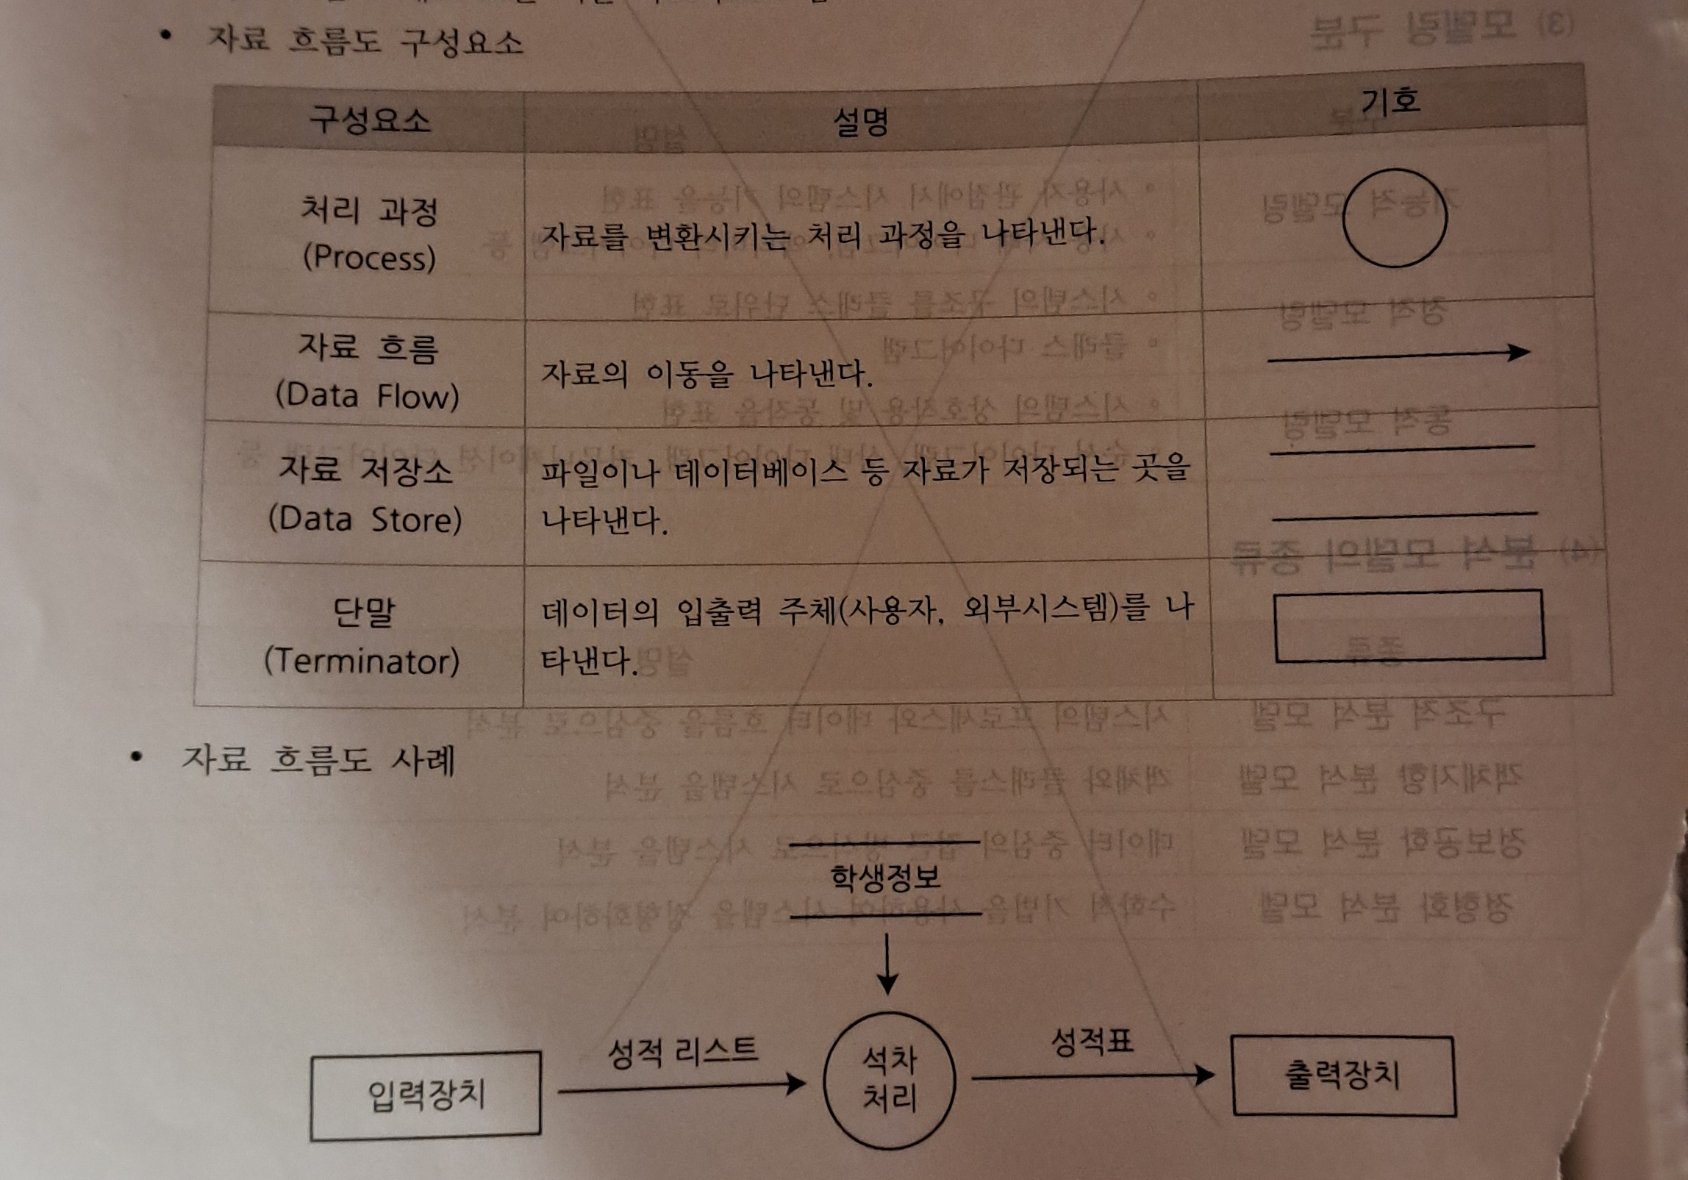
What it is:
A graphical model that shows how data moves through a system — where it comes from, how it’s processed, stored, and where it goes.
Symbols:
Process: circles/bubbles
Data flow: arrows
Data store: parallel lines
External entity: rectangles
Use: Great for analyzing system requirements and understanding data movement between components.
---
Data Dictionary
What it is:
A centralized repository of definitions for all data elements in your system (names, formats, meanings). It ensures consistency and clarity across diagrams and documentation.
Use:
When you use DFDs or ERDs, the data dictionary tells you precisely what each data item is (e.g., “OrderID = 10-digit identifier for orders”).
---
Mini-Spec (Process Specification)
What it is:
A detailed description of what each process does — converting inputs to outputs. It’s sometimes called Mini-Spec or process specification and often uses structured English, flowcharts, or decision tables.
Use:
Fills in the gaps that diagrams leave — especially how a process works step-by-step.
---
Entity-Relationship Diagram (ERD)
What it is:
A diagram that shows data entities and their relationships (e.g., Customer, Order, Product) in a system.
Key elements:
Entities: things we store info about
Attributes: details about entities
Relationships: associations between entities
Use:
Essential for database design and data modeling.
---
ㅇ State Transition Diagram (STD)
What it is:
A diagram showing the states an object/system can be in and how events cause transitions from one state to another.
Example use:
How an order moves from “New → Processing → Shipped → Closed” based on events like payment received or order canceled.
Typical symbols:
Rounded rectangles: states
Arrows: transitions
Black circle: initial state
Bullseye: final state
---
🧩 Object-Oriented Analysis Tool
UML (Unified Modeling Language)
What it is:
A standardized visual modeling language used to represent software system structures and behaviors. UML includes many diagram types (class, use case, sequence, activity, state, etc.) for different purposes.
Common UML diagram categories:
Structure diagrams: e.g., class diagram, object diagram
Behavior diagrams: e.g., activity, state machine diagrams
Example — UML State Diagram:
Shows the behavior (states and transitions) of a particular object based on events.
---
📌 Summary Table
Tool What It Models Typical Use
DFD Flow of data in a system System analysis & requirements
Data Dictionary Definitions of data elements Consistency across diagrams
Mini-Spec Detailed process logic Explains what each process does
ERD Data entities and relationships Database design
STD Object/system states & transitions Behavior modeling
UML A suite of diagrams for software Object-oriented analysis & design
---